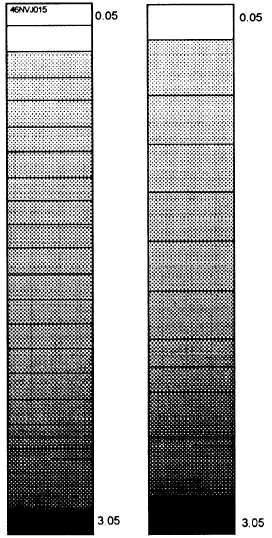
Figure 2-2.—Step tablets.
the development processes. It is also called an H and
D, D log-H, D log-E, or sensitometric curve.
Characteristic curves are plotted on graph paper.
The vertical axis represents the amount of density,
created by each step of exposure. These logarithmic
values are read directly from a densitometer. The
density values increase from the bottom to the top of
the graph.
are uniform. Exposure increases from left to right on
the horizontal axis.
The horizontal axis of the graph is used to
indicate log exposure (log H). The horizontal axis
represents the amount of exposure the material
received. Exposure must be converted to a
logarithmic value, so the scale of density and exposure
When the sensitometric strip is made with the
Eastman Kodak No. 2 Step Wedge (21 step), there is
an increase of about 0.15 in density between each step
or an increase of 50-percent density. The individual
steps should be calibrated by reading the step on a
densitometer for the greatest accuracy. The densities
of steps range closely from 0.05 to 3.05, but the
density of the individual steps may vary slightly. For
illustration purposes, the step tablet used in the
following example has exactly 0.15 density differences
between each step.
2-7