PLOTTING CHARACTERISTIC CURVES
Once the graph is labeled, use a densitometer and read the densities of
the sensitometric strip and plot them on the graph to form a curve.
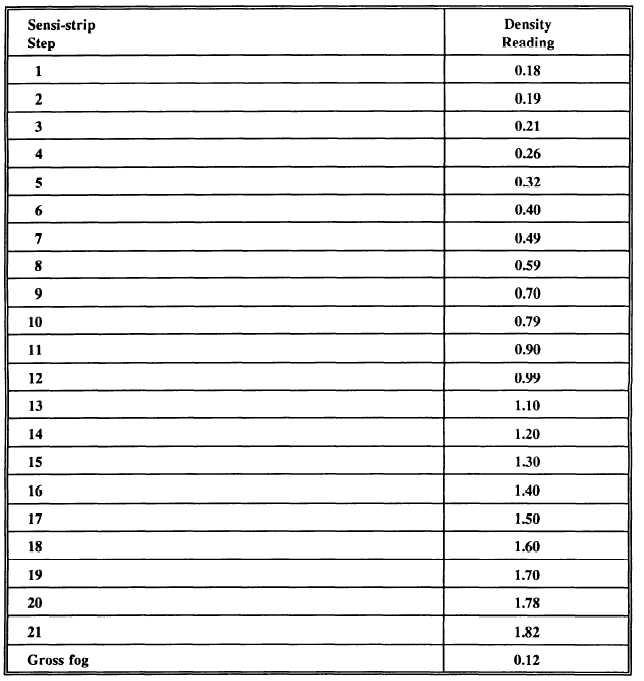
Assume that the sensitometric strip has the following density readings:
To plot these densities on the graph, find the
density value reading of step 1 and place a dot at that
point. Do the same with steps 2 through 21, as shown
in figure 24. After plotting all the readings, connect
the plotted points with a french curve and straightedge
(fig. 2-5). You do not necessarily want to connect
each plotted point. The resulting curve should be a
smooth, flowing line with no angles apparent.
Remember to label every graph with all the
pertinent information, because information that is not
recorded on the graph may be lost or forgotten. This
2-8