Any monitoring system for the photographic
process requires that a reference or standard be
established. By systematically comparing daily
production to the reference, you can detect, identify,
and correct errors in procedure.
Any photographic quality assurance system should
be built around the science of sensitometry. In its
broadest terms, sensitometry, as applied to the whole
photographic process, includes methods of
measurement, process control, and data analysis. It
deals with all areas of the photographic process, from
exposing film to viewing the final image.
SENSITOMETRY
In the Photography (Basic), NAVEDTRA 12700,
training manual, the quality of the photographic
product was judged only from its visual aspects. As
a further step, you should know of other controlled
working methods and techniques that ensure
photographic quality. This area of control, or
sensitometry, is one method of using certain
photographic theories to improve photographs while
saving time, effort, and materials.
With sensitometry, variations from the standard
and recommended corrections are expressed in
numbers and not in terms of personal opinion.
Sensitometry provides a permanent record of the
process and indicates whether the system was in
control when a given film or paper was processed
The accumulated data is helpful for determining the
cause of poor quality and the exact amount of
deviation from the standard.
The first requirement in photographic quality
assurance is establishing a standard for good
processing and the range or limit that quality should
not exceed. The standard is based on developing the
same film or paper that is given a known exposure
and comparing the resulting densities.
Black-and-white processing is discussed first in the
following paragraphs.
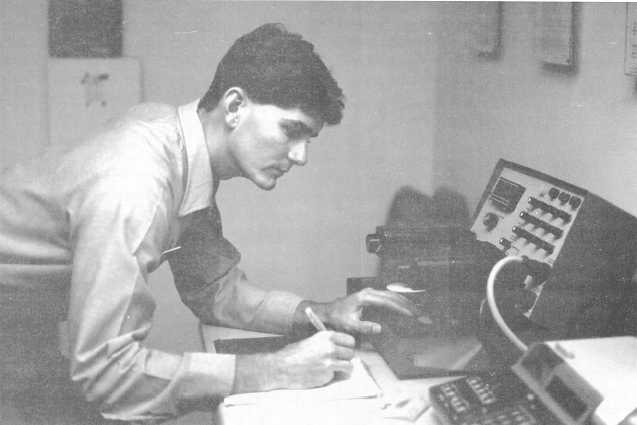
Figure 2-1.—A Photographer’s Mate uses a densitometer to read a control strip.
2-2