When you are using a new developing solution,
time-gamma or time-contrast index charts (as
appropriate) must be developed for the variety of
films to be processed in it. Given time, temperature,
and agitation for each particular film in the developer,
you will be able to see the results on these time
charts.
After the developer solution has been proven, you
should process a sensitometric strip with each process-
ing run. Each sensitometric strip should be read with
a densitometer and plotted on the appropriate pro-
cess-monitoring chart. As a minimum, you should
process and plot a control strip after start-up and
before shut down or at the beginning and end of each
work shift. Once the densities are recorded and
plotted, an accurate graphic representation of the
activity of the process is provided.
QUALITY ASSURANCE
CONTROL CHARTS
In photographic processing, control charts are used
to monitor the status of specific solutions and the
physical process. A list of numbers can be studied
carefully to see whether they are out of line; however,
when the numbers are plotted on a chart, you can see
instantly whether there is data out of order.
Photographic quality assurance control charts can
be prepared for gamma or contrast index, minimum
and maximum density (D-min and D-max), average
density ( ), gross fog, temperature, pH, specific
gravity, or any other variable that may be required by
your quality assurance program. To be useful in your
quality assurance program, you must collect and
record data relative to these and other specific
factors. From the recorded data, you can calculate the
mean or average, and determine the upper and lower
limits.
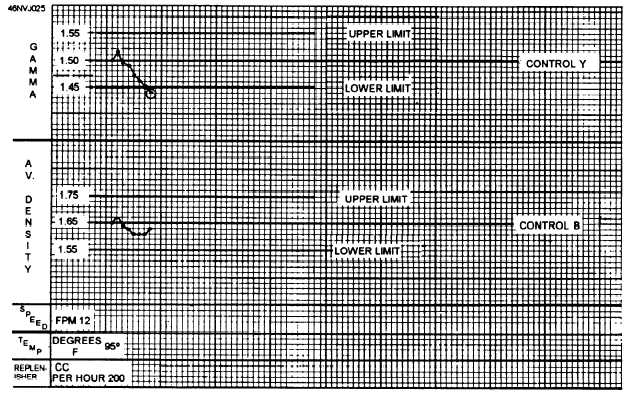
If, for example, the control gamma in an aerial
film processor is 1.50 and the desired average density
is 1.65, you must have a method for indicating when
the gamma or varies to the point where the end
result is no longer desirable. When the gamma
tolerance limit is ±0.05 and the tolerance limit
is ±0.07, the control chart appears as shown in figure
2-12.
Figure 2-12.—Control chart.
2-23